Introduction

Science has made clear that global warning is correlated to the increase of greenhouse gases in air.
As Jean-Marc Jancovici, Founding Partner Carbone 4 & President of The Shift Project bluntly reminds us: "the greenhouse effect is a phenomenon that has been known for two centuries. We have known for more than a century what happens when we double the amount of CO2 in the air. People who claim the opposite - the climate-sceptic type - are all impostors, i.e. someone who claims a legitimacy that he.she does not have.
This increase of greenhouse gases concentration in air throughout the industrial revolution is resulting from the combined exponential increase of energy usage and a deterioration of natural greenhouse gases sinks due to human activities.
As an effect of global warning, a climate change is happening. We are close to hit one of the critical boundary ensuring the stability of the planetary system, and therefore, humanity's capacity to maintain its well-being. As conceptualized the by K. Rayworth through "the doughnut ecological and social boundaries for humanity" (see introductory video and full article), human activities have indeed lead to push several indicators in a critical zone.

Today, it is our role to keep these ecological and societal indicators under a certain limit as a safeguard for human's life integrity.
In this context, in it's 2018 special report "Global Warming of 1,5 °C", the International Panel on Climate Change (IPCC) calls for a rapid and far reaching transformations on energy, land, urban and industrial infrastructures.
As an effect of global warning, a climate change is happening. We are close to hit one of the critical boundary ensuring the stability of the planetary system, and therefore, humanity's capacity to maintain its well-being. As conceptualized the by K. Rayworth through "the doughnut ecological and social boundaries for humanity" (see introductory video and full article), human activities have indeed lead to push several indicators in a critical zone.
(source:https://www.kateraworth.com/doughnut/ for indicators definition details)
Today, it is our role to keep these ecological and societal indicators under a certain limit as a safeguard for human's life integrity.
In this context, in it's 2018 special report "Global Warming of 1,5 °C", the International Panel on Climate Change (IPCC) calls for a rapid and far reaching transformations on energy, land, urban and industrial infrastructures.
At Bay2Bay, we want to take part of this transformation, We want to be a transmission belt between society stakeholders and innovation entrepreneurs in the fields of energy and lands, in order to accelerate this transformation for a better planet.


- percentage of land used for agriculture / total land
- percentage of forests used for human activities / total forest
- percentage of drinkable fresh water / total fresh water
- .....
"We will never solve the problem of climate change by making it an economic problem; it must become an ethical problem" Ivar Ekeland.
Facts
We do not intend to fall into the category of impostors. Therefore the facts that we provide here are indisputable, reported from legitimate researchers (having published in a peer-reviewed scientific journals)On global warming
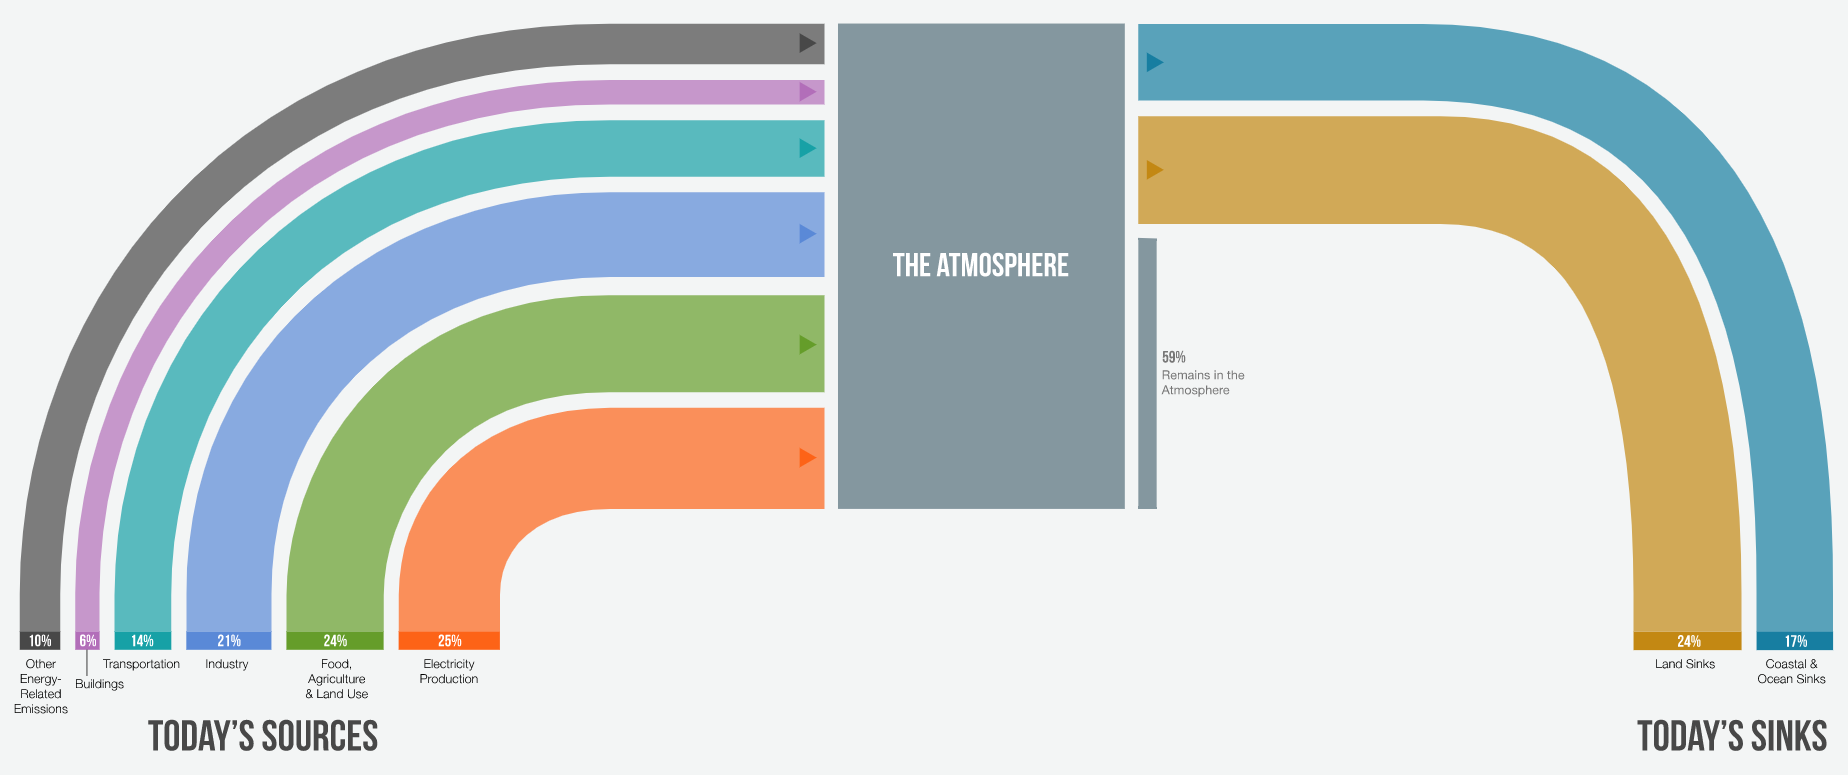
- 55 GTons/year: today's CO2 eq. greenhouse gas emissions worldwide (growth-rate above 10%/decade over the last 4 decades). (source IPCC)
- These gases comes from six main sectors : electricity production (25%), food-agriculture-land use (24%), industry (21%), transportation (14%), buildings (6%) and other energy related emissions (10%). These gases are trapped in Land sinks (24%), ocean sinks (17%). The remaining 59% goes into atmosphere:
On Energy (source J-M Jancovici - conference Science Po Sept 2019 and article)
- Energy is used for: electricity production (main source being coal), mobility (main source being oil) and heat needs
- one liter of gasoline (cost of 1.30€ today) represents in terms of mechanical energy (kWh) the equivalent of 100 (big) pairs of arms for 24 hours at 0.05 kWh each, or 10 (big) pairs of legs over the same period.
- The energy sources- which incidentally are free, since no one has ever made oil, uranium, coal or . - has allowed us to become true "supermans": The amount of energy that we use today on a global average is 20,000 kWh/pers/year. This means that each earthling, thanks to the machines he uses, has multiplied his productive capacity by 200 (mainly over the last three centuries).
- The increase in GDP is a correlation of energy production. As soon as the quantity of energy decreases, the GDP will contract. Or to put it another way, we come up with the following choice: GDP or CO2

Global GDP evolution vs energy consumption from 1965 to 2015
(source J-M Jancovici -https://jancovici.com/ based on WBank and BP stat. review data)
(source J-M Jancovici -https://jancovici.com/ based on WBank and BP stat. review data)
- Knowing, moreover, that the quantity of fossil energy will necessarily decrease. The peak of conventional oil (excluding shale gas and oil sand) has been reached in 2008. We do not see the impact yet because the USA, which has become the world's leading producer (18 M barrels/day), flooded the market with its shale gas.
- Long-term structural growth does not exist in a finite system.
- question: can we maintain democracy - which is the art of promising more to everyone - in a world where fossil energy will decrease? To illustrate this, J-M Jancovici is laying down this simple equation

In a growing population democracy, politicians with reelection deadline in mind, are focussed on job creations ("Jobs" going up) and increasing income per capita (i.e "Jobs/GDP" going down). And Jancovici to ask our selves: in a world of energy contraction ("NRJ" going down), are we ready to compensate and sacrifice our individual incomes ("Jobs/GDP" going up) to increase jobs levels ("Jobs" going up), even though one can expect energy efficiency from innovation ("GDP/NRJ" going up) ?
On Food, Agriculture and Land
- Pressure on food (and subsequent agriculture) production system is coming from growing world population (from 5,9 B in 1997 to 7,6 B in 2017, and is expected to grow up to 9 B by 2050) and growing calories/capita/day demand as benefit from worldwide GDP increase (from 2,700 kacl/cap/day in 1997 to 2,900 cal/cap/day in 2017 expecting to grow close to 3,600 cal/cap/day in 2050). (source FAO stats)
- More than 4,2 B persons lives in urban areas today. About 90% of population increases is concentrated in these urban areas, adding pressure on food production and distribution system. (source FAO stats)
- Thankx to globalization, food import/export value has grown 300% over the last two decades, and count today for almost half of the world food production value (representing an +250% increase in 2 decades only). (source FAO stats)
- As a result of this food production intensification, several ecological indicators have reached a critical zone: (to expend)
- percentage of forests used for human activities / total forest
- percentage of drinkable fresh water / total fresh water
- .....
Comments
Post a Comment